A playful experiment in map-making: Safe havens, innovation highways, and the desert of missing data
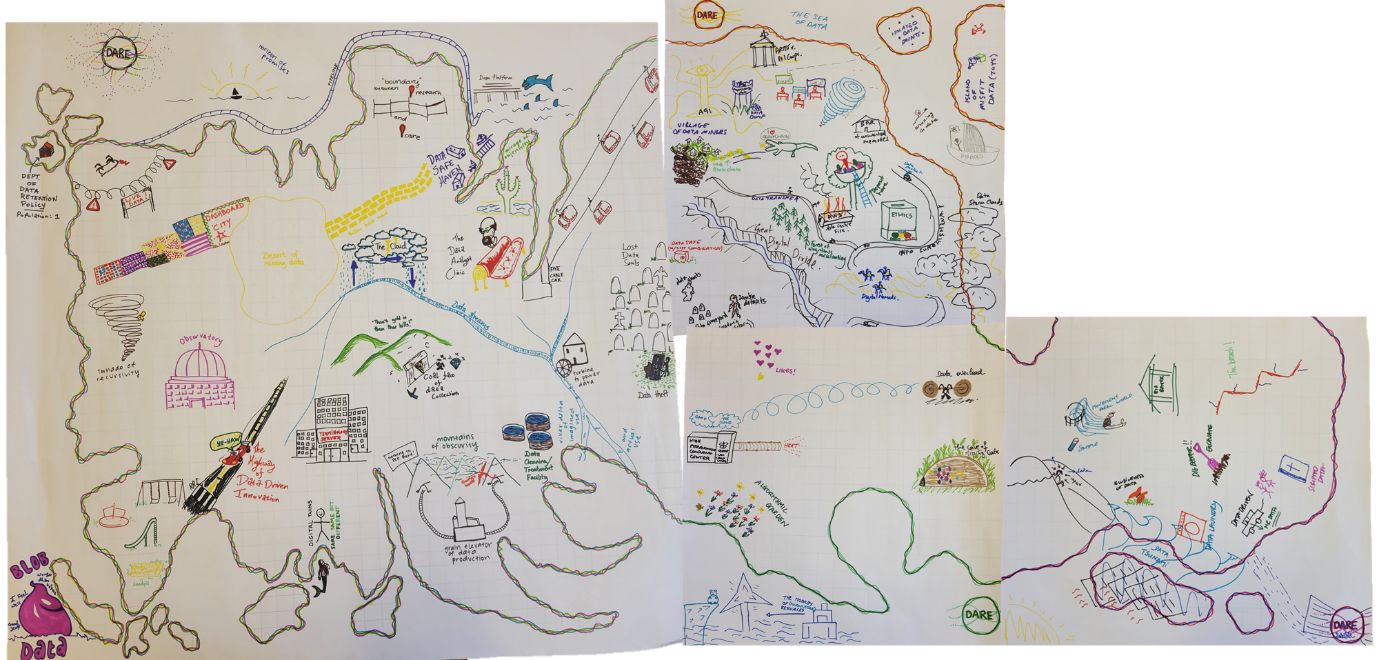
As an interdisciplinary research team with quite different trainings and research foci, the DARE team takes a reflexive attitude towards collaboration and actively seeks new and creative ways to think through our work together. In May, we met at Secret Solstice Games in Leith to think playfully about health and care data through an activity developed from fantasy table-top roleplaying games. We further opened up this activity to colleagues in Science, Technology, and Innovation Studies in a workshop session at the recent AsSIST-UK Biennial Conference. The results are multiple: a composite fantasy map featuring places like ‘Dashboard City’ and the ‘Horizon of Promises’; novel insights into our individual and group understandings of data; shared experiences of fun and creativity as a team; and many more questions to explore throughout the next three years of DARE.
The activity was guided by the novel intersection of three streams of thought, as well as a chance encounter.
First: play and playfulness are legitimate and generative ways to collaborate. There is a long history within Science and Technology Studies of taking play seriously as a way to think and work across disciplines, to build collaboration, to expose assumptions and find frictions, and to imagine alternative futures together.
Second: maps are fantasies about our world and others. Studies in the History and Philosophy of Science, Science and Technology Studies, and Critical Geography have established that maps bear a complex relationality to the physical world, helping to construct reality rather than straightforwardly representing it. Maps embody claims about the world and facilitate particular kinds of thought and action.
Third: geographical metaphors about data are ubiquitous. Depending on who you speak to, data might be mined like coal or refined like oil; it might live in ‘the cloud’ or flow as a stream; it might come in a deluge and cause a flood. Each metaphor comes with particular connotations, and following and stretching its logics can lead conversations about data to unexpected places.
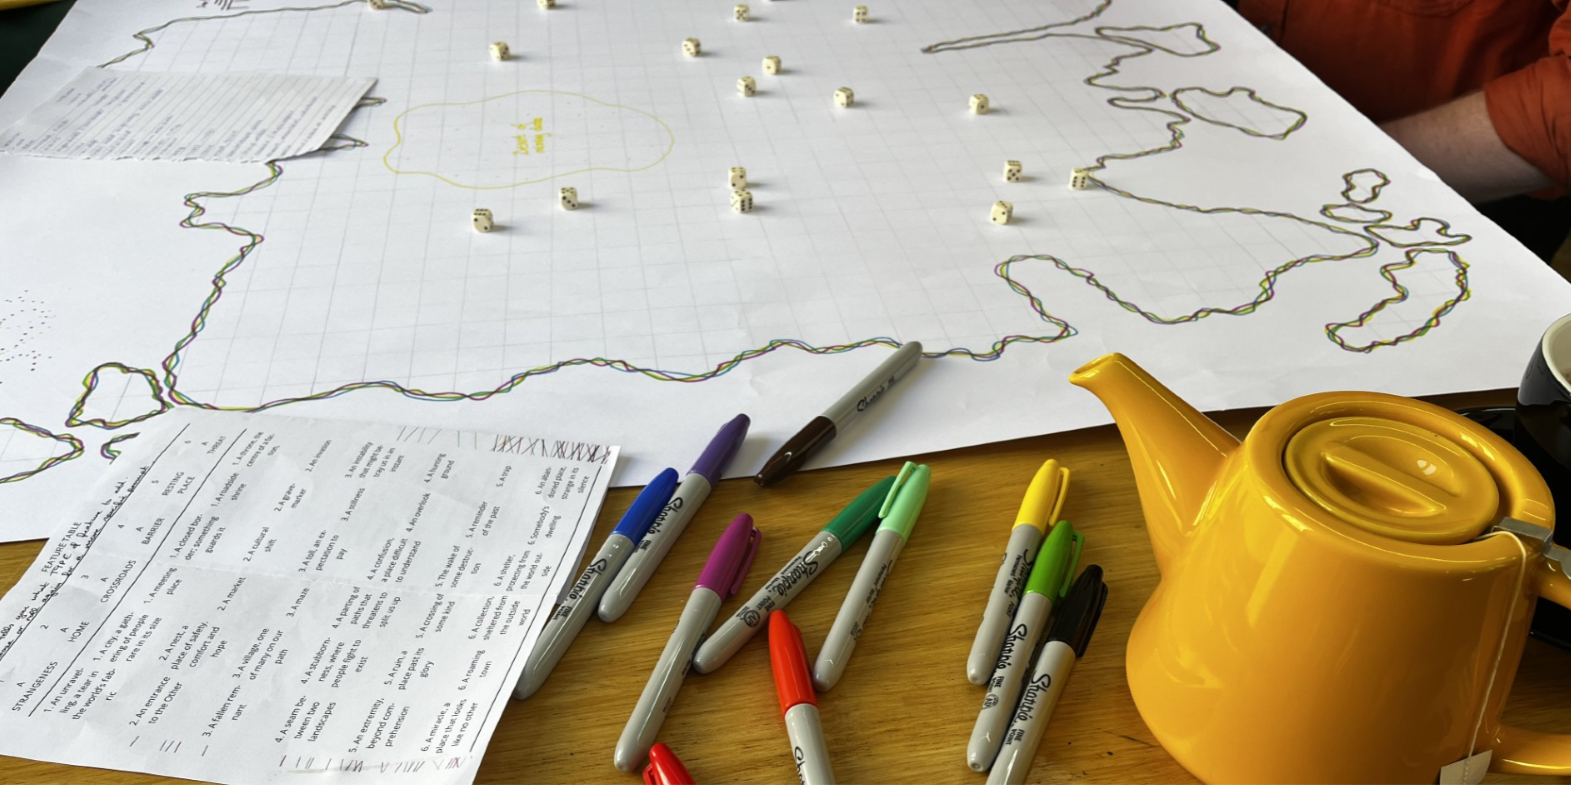
Finally: Edinburgh’s 2024 Tabletop and Graphic Storytelling (TAGS) Festival introduced me to Ryne, a Table-Top Fantasy Role-Playing Game (TTRPG) and – more importantly – Ryne: The Path, a map-making mini-game. In Ryne, players traverse a living landscape partly composed of aged titans “who build – are built from – the very fabric of the world”; players are “the people who live tangled in their threads”. Ryne: The Path invites players to collaborate together to draw the tabletop map on which the game takes place, using dice throws and a ‘Features Table’ with 36 creative prompts (‘A seam between two landscapes’; ‘a cultural shift’; ‘a crossing of some kind’).
The resonance between a living landscape and ideas like ‘data clouds’ and ‘data floods’ was irresistible to me, as was the potential to open up a creative space where the DARE team might explore the potentialities of those metaphors. The tension inherent in every map between the opportunities and restrictions it might offer is an explicit aspect of game design, and in TTRPGs maps are carefully designed to maintain a fine balance between their rigid and flexible elements to provide a framework for players to make their own reality and tell stories together. Ryne: The Path offered us a basis for a way of thinking that combined elements of chance and opportunities for creativity with a structure to clearly bound our activity.
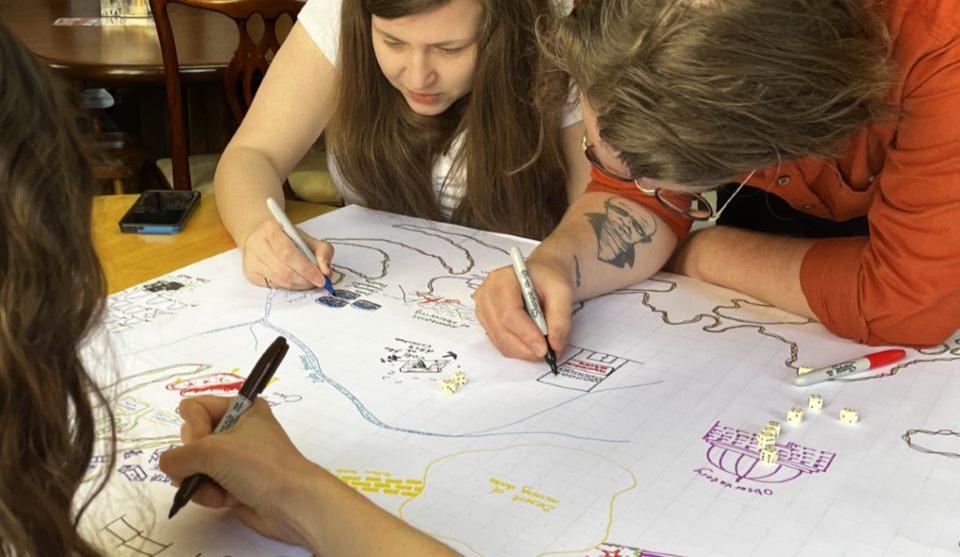
Working with a simplified version of the rules from Ryne: The Path, the DARE team rolled dice across a blank map we had made in advance, then took it in turns to remove a die and add a data-based feature to our map. At first, we were slow to put pen to paper: at times it was difficult to think of something to add, or to decide between multiple ideas. These became group decisions, where we sounded out our ideas and talked through how each might be represented and what its connotations were. As we became more comfortable with the rhythm of the game and more confident adding to a no-longer-pristine template, our drawing and thinking seemed to speed up as our map evolved. Each addition to the map suggested further ideas at the same time as claiming and taking up space on the paper: we might say that the map’s affordances reconfigured in real time. Factors outside the map shaped it too: the particular colours in our selection of pens and our individual positions around the table (it wasn’t long before we were out of our seats and moving around in order to view and contribute to the map from different perspectives). Different styles of working also emerged: some of us referred to the Feature Table more often than others; some were bold in adding new features to the map, and others preferred extending and adding detail to others’ contributions.
At the end of the session, our map had captured many of the things we have been discussing as a team throughout the project so far, as well as ideas and problems we had come across as individuals. More importantly, though, the process of map-making collaboratively had prompted generative discussion throughout. Data metaphors had been brought into new relations to each other as they were placed on the map, suggesting new ways to ‘think with’ places, objects, people, ideas, and their living consequences. We found ourselves differently equipped to think through those consequences, and we found unexpected points of convergence and divergence. Some additions to the map prompted reflection on past projects, the sharing of moments from fieldwork that had not materialised in our regular team meetings, and plans for the DARE project and our individual work packages.
When we organised a shortened version of the activity for colleagues attending AsSIST-UK 2025, we saw both repetition and novelty compared to our own experience. Again, some people were very hesitant, whereas others seemed to be bursting with ideas to add to their map. Some features reappeared in a new incarnation: the ‘tornado of recursivity’ signifies the looping and recursive relations between big data and the algorithms that analyse them, whereas the ‘data tornado’ connotes a large, overwhelming and fast-moving collection of data; ‘the cloud’ is a place where data is collected, stored, and released, whereas the ‘data storm clouds’ have a more ominous feel. The map outlines we provided were designed to connect to the first map, but participants did not know how they would fit together. Putting them into position created new juxtapositions including, quite by chance, the appearance of ‘data ghosts’ right next to the graveyard of ‘lost data souls’, and a cable car leading to the ‘AGI of Sauron’. This was an unplanned but valuable aspect of the activity, adding another opportunity to surprise ourselves and generate new connections and ideas.
Interdisciplinary collaboration demands imagination, and by using play as a research method we found imaginative ways to think with and about data and its metaphors. Beyond the process and the material, we also learned more about each other and how to collaborate together. Looking forward, we want to explore the possibilities for using this and similar activities to track how our understandings of data, data metaphors, and their connections evolve across the project. We might also consider different forms of data, including our own study data.