
Introducing: Georgia Kerr
“What happens when a body of literature goes through a transition from something that one person might read all of, to something far larger than anyone can digest?”
Christopher Kelty and Hannah Landecker (2009)
I joined the DARE team as a research assistant in late September, 2026, a few months after completing my PhD in Social Anthropology and Science, Technology, and Innovation Studies at the University of Edinburgh. My PhD project focussed on the collaborative and creative work of laboratory scientists engaged in early drug discovery and basic research on Huntington’s disease. My interest is in the ways that we imagine and talk about innovation and technology as it relates to health, medicine, and healthcare: What kinds of futures are we making, or hoping for, or foreclosing when we imagine, produce, or embrace new technologies? What kinds of promises are developers and manufacturers making to healthcare professionals and patients? What is at stake when a technology fails to deliver on a promise, and what are the costs of success? Finally, is there, actually, anything new about ‘new technologies’?
My role on the DARE project is to conduct an ethnography of The Literature [1] on ‘big data in healthcare’. The goal is to apply an ethnographic eye, adapted from sociocultural anthropology, to engage with a body of literature in a similar way to how we might engage with an informant. That is, to place it in its context and take seriously what it reveals to us about the social and cultural world it inhabits, the kinds of narratives it tells, and the ways it reacts to or creates change.
It is difficult to gain a sense of any field of science as it is coming into being. ‘Innovation’, especially in science, is extraordinarily non-linear, not least because the majority of scientific experimentation fails. So, while we may be able to trace the history of a particular technology back through previous versions, editions, prototypes, patents, and other successes, its precipitating failures are often lost to the depths of laboratory notebooks and OneDrive folders. Most scientific journals do not publish failed experiments—and given the nature of the job market, it would not be in the professional interests of academics, nor the reputational interests of institutions, to do so. Nevertheless, scientists do publish, and they publish a lot. This is where an ethnography of The Literature comes in.
As social scientists, when we want to find out what is going on—and what has been going on—in a field, we tend to do the social science thing: we ask people in that field. However, when we interview or work with scientists, we are limited to their expertise, knowledge, and interpretation of their field. This is highly valuable, interesting, and productive on its own, but in massive and rapidly-developing fields like data technologies and data science, it might be helpful to have another prism through which to view the field. If we look at The Literature, then, as though it is an informant, we can hopefully get a much broader view of what is and has been going on.
The benefit of this is that we are limited only by our own search parameters. The difficulty of this is that we are limited only by our own search parameters, and so now we must find a way to critically and productively analyse 12,000+ papers.
If we are interested in gaining a broad overview of the publication landscape of such a large field of study, a good first step is to conduct a bibliometric analysis. A bibliometric analysis takes bibliographic information like author names, keywords, funding bodies, and citations, and allows us to identify trends and relationships among them. Significantly, a bibliometric analysis is not itself a particularly qualitative process: it does not evaluate the contents, validity, or quality of the papers. For example, if Paper X has 462 citations and Paper Y has 618, this does not mean that Paper Y is of a higher quality: it might be an artefact of relative age (older papers tend to have more citations), or it might be that Paper Y is so controversial that half of its citations are criticisms. (AI-based ‘sentiment analysis’ is sometimes used to help determine the ‘tone’ of citations, but it remains much less reliable than human readers, and so requires human validation [2][3]). A bibliometric analysis can therefore be very useful in identifying influential papers in the field, collaboration or co-authorship patterns between researchers or institutions, or trending topics for a given time period.
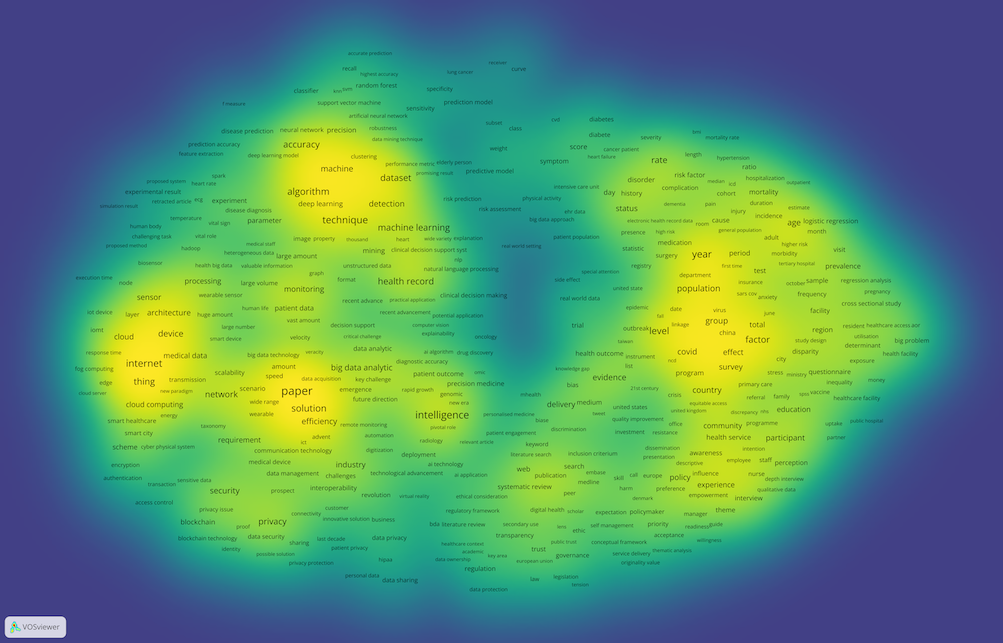
For the first month-and-change of my role, I have been learning how to conduct bibliometric analyses, using Excel and VOSviewer to analyse the bibliometric data and produce visualisations to illustrate the trends and links in the literature. As well as visualising who is citing whom, VOSviewer runs an analysis to determine which words/phrases show up the most frequently within the set of papers and how they link to one another, and gives each word/phrase a ‘relevance’ rating based on factors like whether it shows up only in the introductory parts of articles (less relevant), or whether it occurs throughout the texts (more relevant). Some of these ‘keywords’ offer good insight into the main interests of the field, and others are artefacts of the standardisation of academic writing: in the dataset of literature I am working with, for example, VOSviewer determined that the single most relevant term, with a relevance rating about four times higher than anything else, was the phrase “massive amount”. (And while this is not at all analytically useful for my ethnography, it is validating).
The next step is to find a way to qualitatively analyse and interpret the information produced by the bibliometric analysis for two key reasons: to check that these purely computational results are valid; and so that we might be able to gain some insight into the field as a ‘living’ thing collaboratively produced by people.
Many researchers trying to get a qualitative overview of a field of study begin with a literature review, narrowing the scope of our own interest and expertise to a sharp point which can be used to cut through the literature until we have a manageably small slice. Ideally, this should be small enough that we can thoroughly read each remaining piece of work in the slice, in order to evaluate and compare them. This is very helpful if we want to find gaps in the literature in order to conduct of justify our own research, because we can see what has (or has not) been done before. This process is highly qualitative: it relies on our interpretation of the texts, our knowledge of the topic, and our ability to critically and productively place them in conversation.
For obvious reasons, this cannot be done with 12,000 papers. My next task, then, is to begin the two-fold qualitative work of analysing broad trends (over time, across contexts, and between fields), and narrowing down my own analytical focus by pulling at various threads and seeing what unravels.
References
[1] Kelty, C., & Landecker, H. (2009). Ten thousand journal articles later: Ethnography of ‘The Literature’ in science. Empiria, (18), 173-191. https://doi.org/10.5944/empiria.18.2009.2004
[2] van Atteveldt, W., van der Velden, M. A. C. G., & Boukes, M. (2021). The validity of sentiment analysis: Comparing manual annotation, crowd-coding, dictionary approaches, and machine learning algorithms. Communication Methods and Measures, 15(2), 121–140. https://doi.org/10.1080/19312458.2020.1869198
[3] Stolwijk, S. B., Boukes, M., Yeung, W. N., Liao, Y., Münker, S., Kroon, A. C., & Trilling, D. (2026). Can we use automated approaches to measure the quality of online political discussion? How to (not) measure interactivity, diversity, rationality, and incivility in online comments to the news. Communication Methods and Measures, 20(1), 1–25. https://doi.org/10.1080/19312458.2025.2553300